Demonstration
This section goes over a small demonstration of the features of Go Elasticsearch Alerts.
Setup
To see a quick demonstration of how Go Elasticsearch Alerts works in action, first make sure you have Docker installed then clone the respository and run the setup script:
$ git clone https://github.com/morningconsult/go-elasticsearch-alerts.git
$ cd go-elasticsearch-alerts/examples
$ ./start-test-system.sh
The setup script will perform the following actions:
Start an Elasticsearch Docker container
Wait for Elasticsearch to become healthy (if Elasticsearch is not reporting itself as healthy after 10 health checks, the script will exit with a non-zero status code)
Create an index with mappings (called “test-index”)
Write some documents to the new index (these represent the data for which we want to create alerts)
Start a Consul Docker container
Wait for Consul to become healthy (exits after 10 failed health checks)
Start Go Elasticsearch Alerts running in another Docker container
Note: The Elasticsearch and Consul containers will attempt to use ports 9200 and 8500 respectively. If these ports are unavailable then the script will fail.
Now Go Elasticsearch Alerts should be running in a Docker container in your
terminal. You should see some logs appear in your terminal, including the data
the setup script wrote to the test index. The process is now alerting on the
rule defined here.
As you can see in the rule, every two minutes (per the 'schedule' field)
the query handler will make the following request (illustrated as a cURL
request) to Elasticsearch:
$ curl http://127.0.0.1:9200/test-index/_search \
    --header "Content-Type: application/json" \
    --data '{
      "query": {
        "bool": {
          "must": [
            { "term" : { "source" : { "value" : "/var/log/system.log" } } }
          ],
          "filter": [
            { "range" : { "@timestamp" : { "gte" : "now-2m/m" } } }
          ]
        }
      },
      "aggregations": {
        "hostname": {
          "terms": {
            "field": "system.syslog.hostname",
            "min_doc_count": 1
          }
        }
      },
      "size": 20,
      "sort": [
        { "@timestamp": "desc" }
      ]
    }'
If it receives any data, it will transform the data (per the 'body_field'
and 'filters' fields of the rule
) and then write the process data to stdout (per the 'outputs[0]' field).
Elasticsearch
While Go Elasticsearch Alerts is still running, if you write more documents to Elasticsearch that match the rule then Go Elasticsearch Alerts should alert on those documents the next time it triggers (in this case, it will trigger every two minutes). You can try this out by opening another terminal and running the following set of commands:
#!/bin/bash

# Get the current epoch timestamp
NOW="$( date +%s )000"

# Create the request data
cat <<EOF > /tmp/gea-payload.json
{
  "@timestamp": "${NOW}",
  "source": "/var/log/system.log",
  "system": {
    "syslog": {
      "hostname": "ip-127-0-0-1",
      "message": "[ERROR] error getting server health from 192.168.0.1"
    }
  }
}
EOF

# Make the request to Elasticsearch
curl http://127.0.0.1:9200/test-index/_doc \
  --request POST \
  --header "Content-Type: application/json" \
  --data @/tmp/gea-payload.json
Go Elasticsearch Alerts should pick up this newly created document the next time the job triggers and write it to stdout in your terminal.
Consul
When Go Elasticsearch Alerts started, you should have seen a log that looked like this:
go-elasticsearch-alerts | 2018-12-13T15:45:04.798Z [INFO] This process is now the leader
This is because we are operating in distributed mode (as specified by the main configuration file). Since we only started one instance of Go Elasticsearch Alerts, the process immediately acquires the lock from Consul. However, if we were to start multiple instances then only one of them would announce itself the leader since only one instance can have the lock at any given time.
You can also see the lock itself in Consul. To do so, open a web broswer and navigate to Consul. The Consul UI should open in your browser.
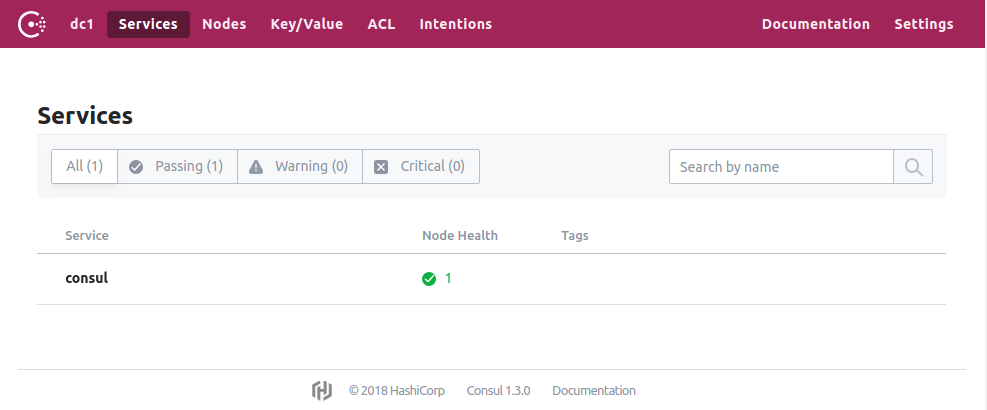
The lock itself is stored in Consul’s key/value store. You can see the lock in the your Consul UI here. It should look like this:
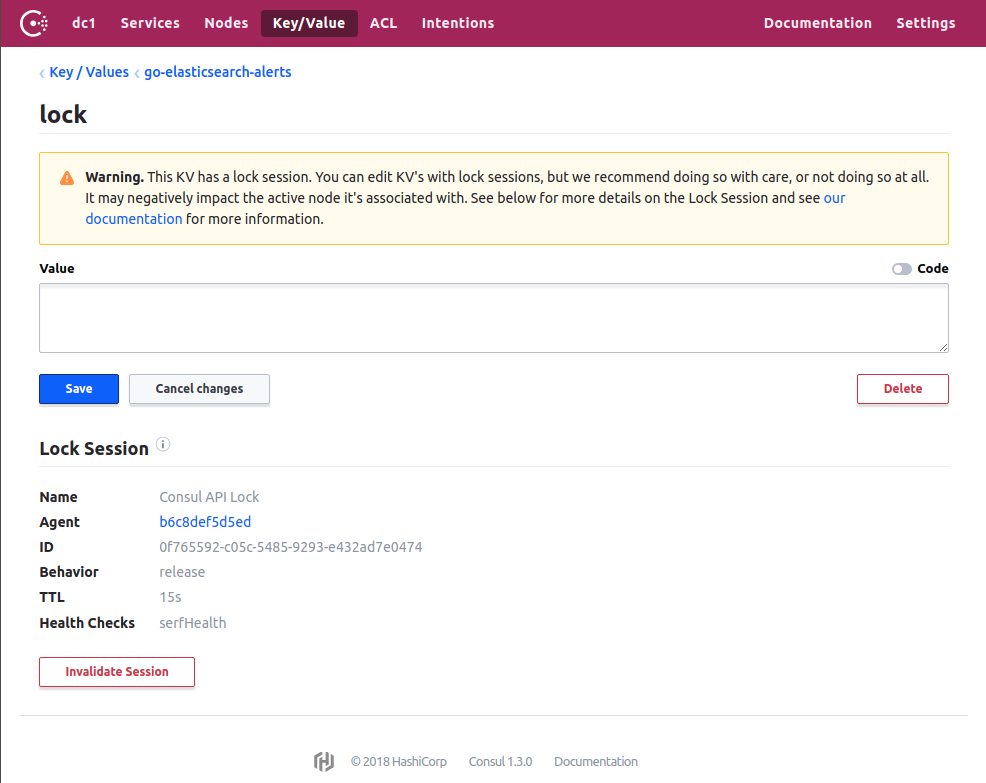
If you delete the lock, Go Elasticsearch Alerts should announce that it is no longer the leader but very quickly become the leader again. This is because as soon as the lock is deleted, it will create a new one. If you stop Consul, then Go Elasticsearch Alerts will also terminate.
Cleanup
Once you’re done with the demonstration, stop the Go Elasticsearch Alerts
container (Ctrl+C) and then run docker-compose down.
